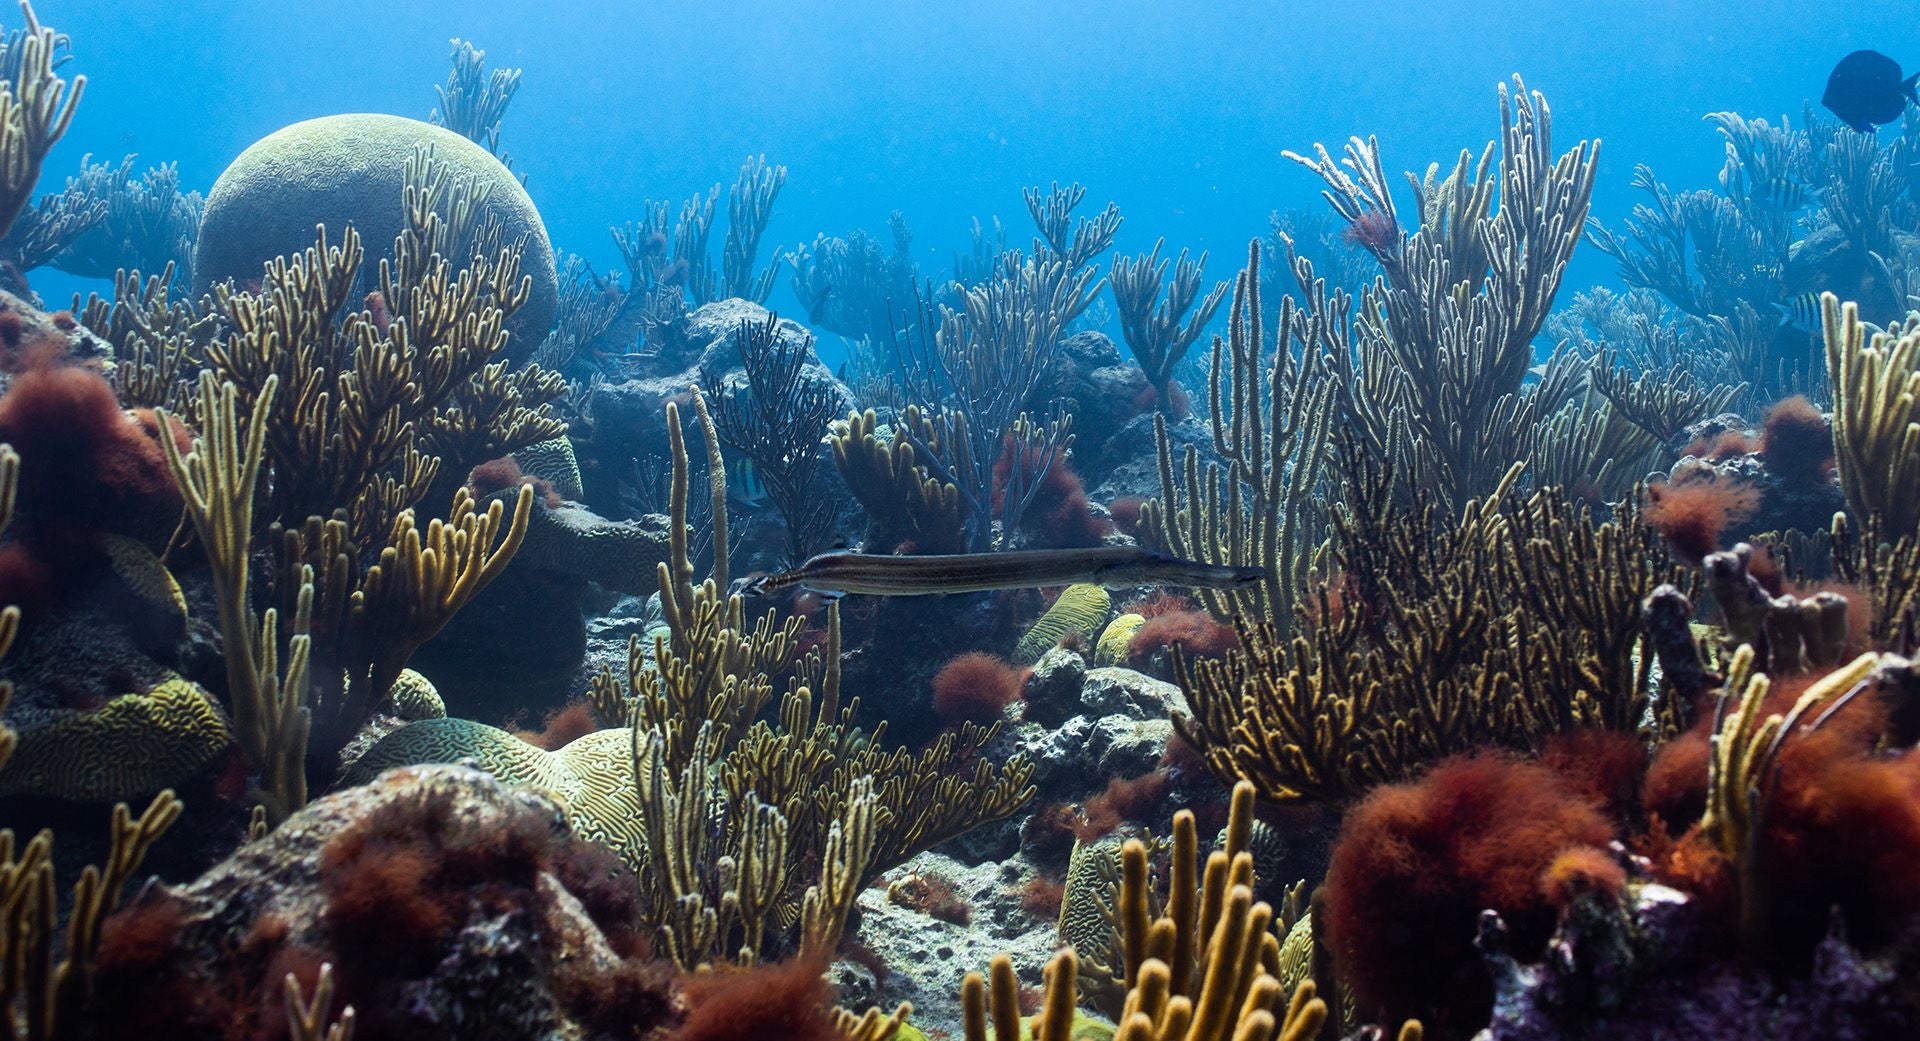
Data Taste
Estimated time to complete: 45 minutes
Estimated time to complete: 45 minutes
ImageJ is a free software that can be used to measure a variety of marine animals, including fish, mollusks, crustaceans, and corals. Researchers can use this software to analyze body lengths, shell sizes, or other morphological features of marine organisms for studies related to growth, population dynamics, or ecological assessments.
This module can be run through the web-base tool, but we recommend the free download Desktop tool for this module.
Once the ImageJ software has been downloaded to the desktop, a number of functions can be utilized. Calibration in ImageJ is the process of establishing the relationship between pixel dimensions in a photograph and real-world measurements. The image is calibrated using a known measurement, usually contained within a scale bar of the image.
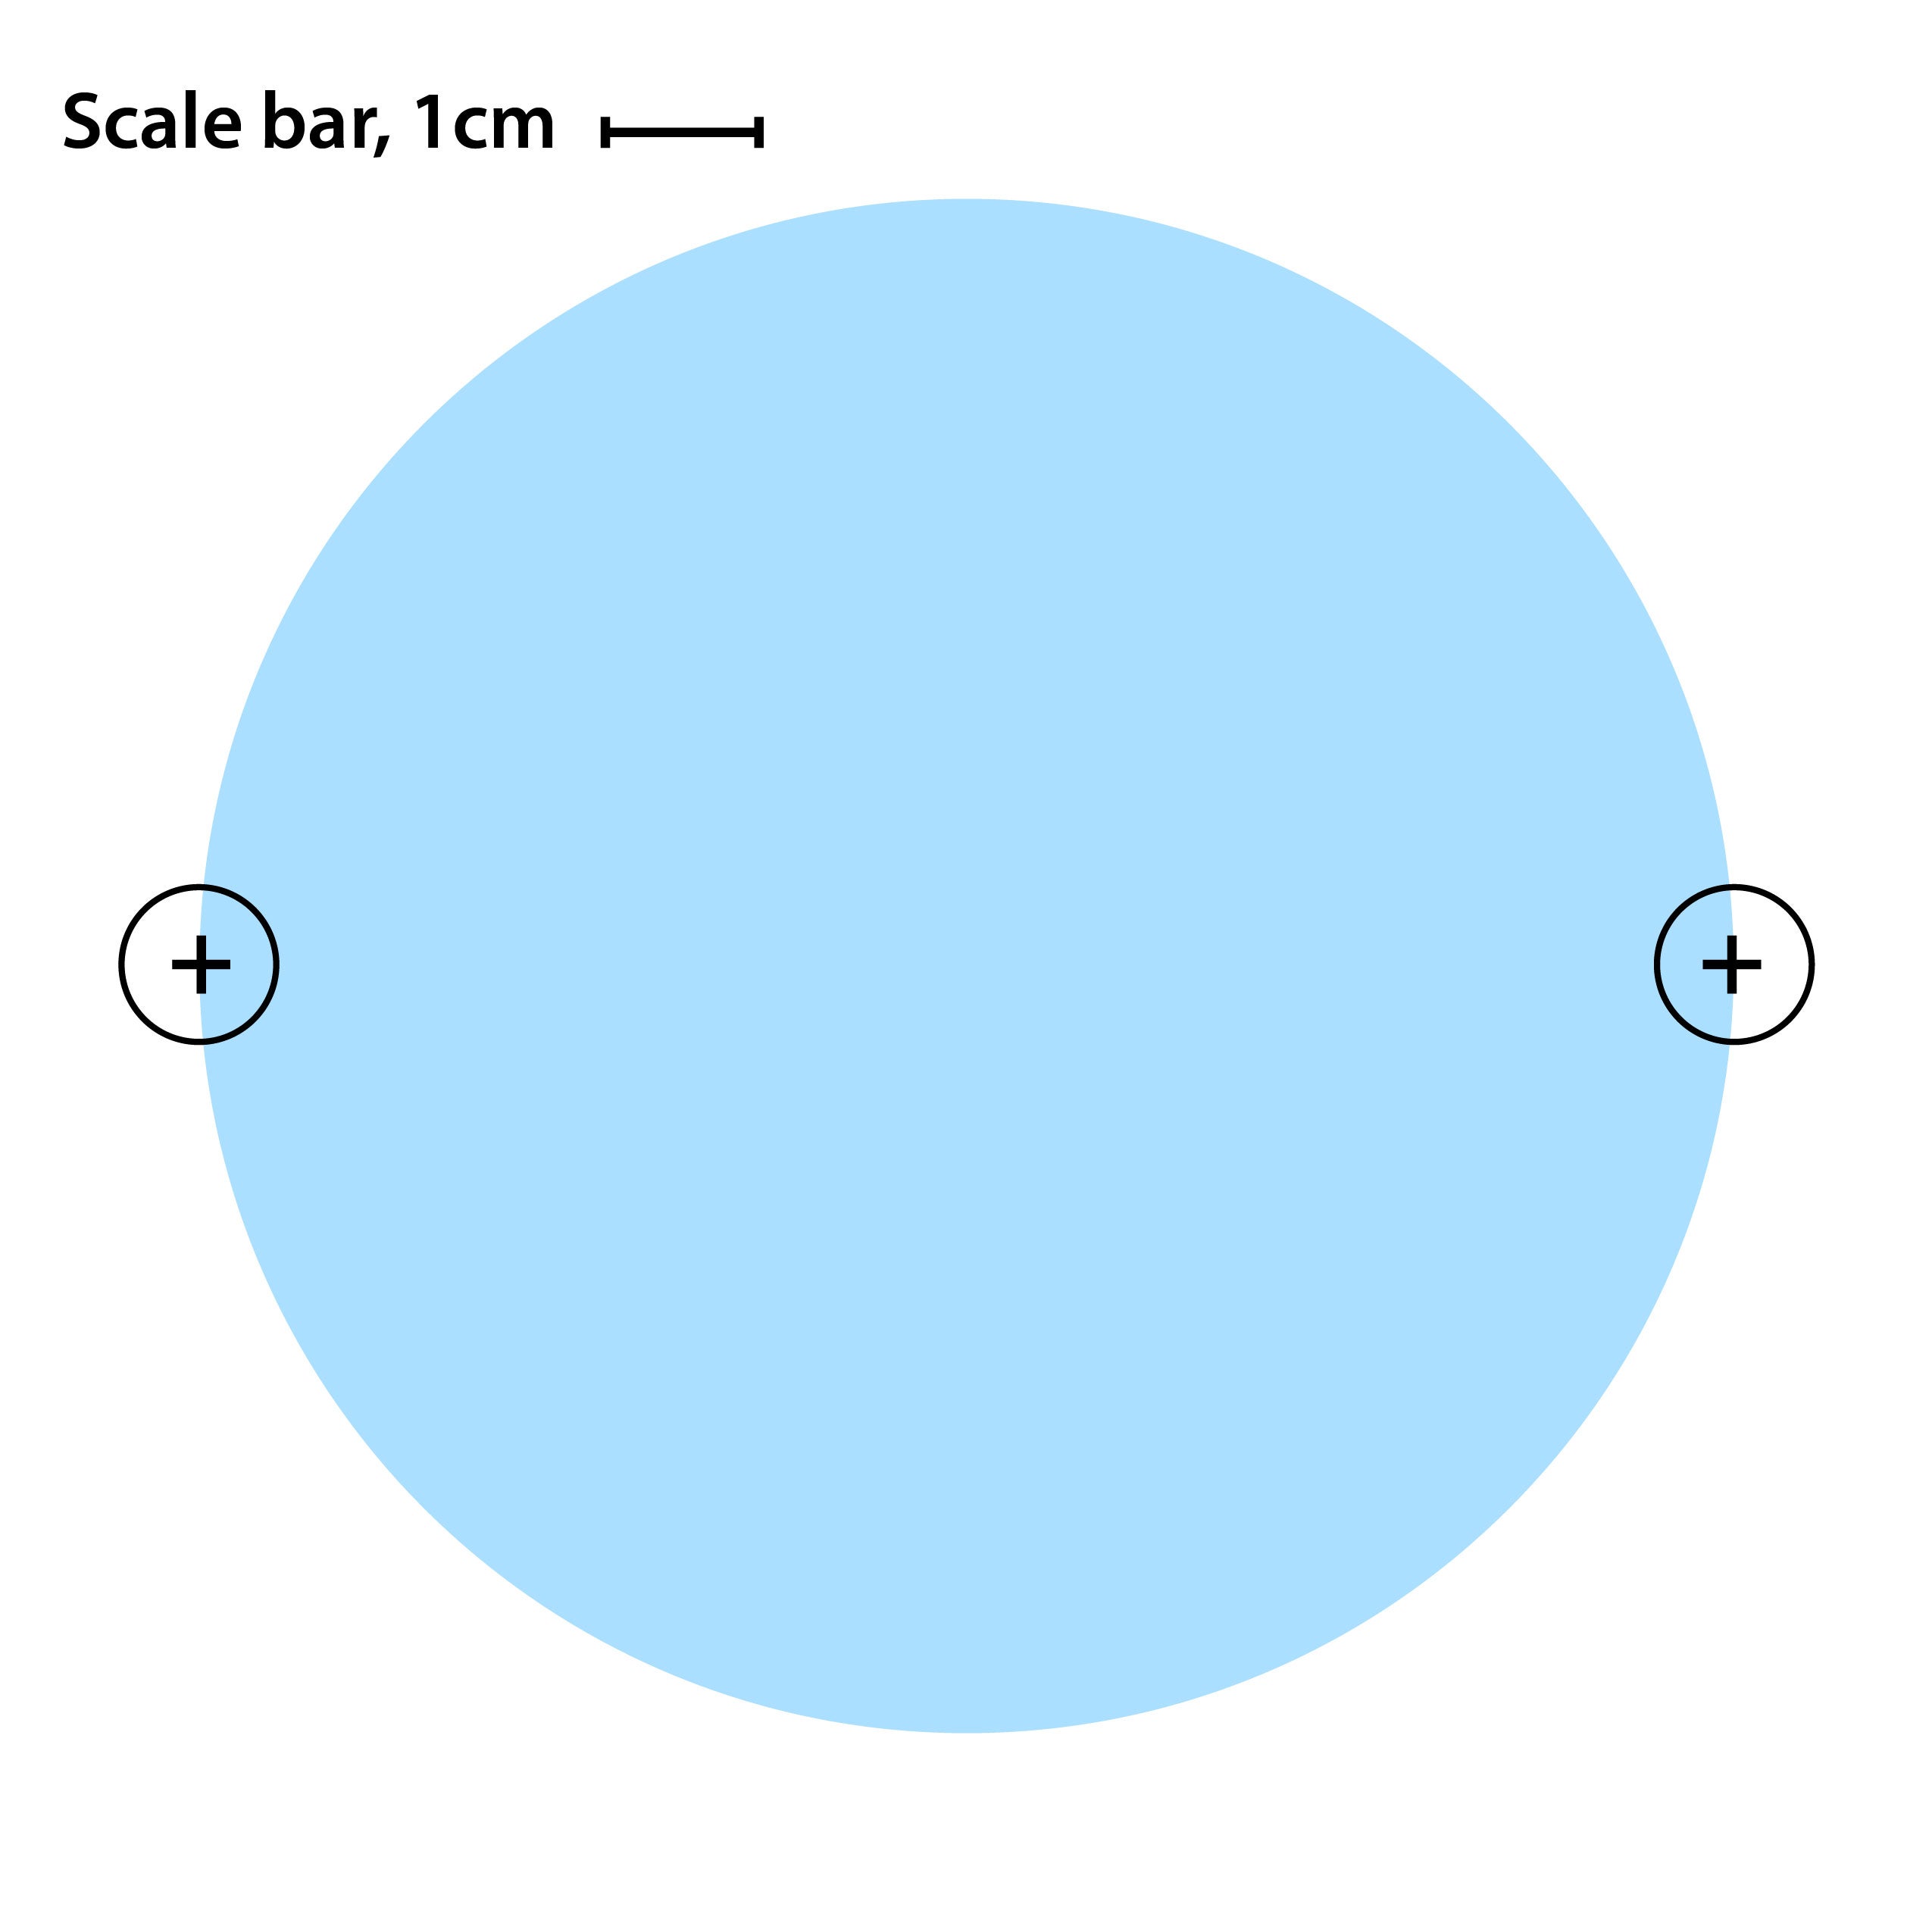
Download the practice image and save it to a known location with the title of “cal_practice_image”.
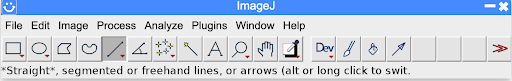
Within ImageJ go to “File” located in the far left of your toolbar and select File → Open. Navigate to the cal_practice_image.jpg that you have saved to open this file within ImageJ.
Next, navigate the toolbar to select the straight line tool ![]() and select.
and select.
Navigate to the scale bar within the image to create a straight line directly on top of the entire length of the scale bar by clicking and dragging the line with the mousepad.
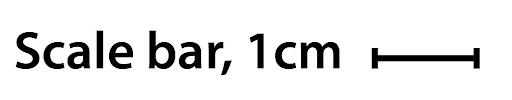
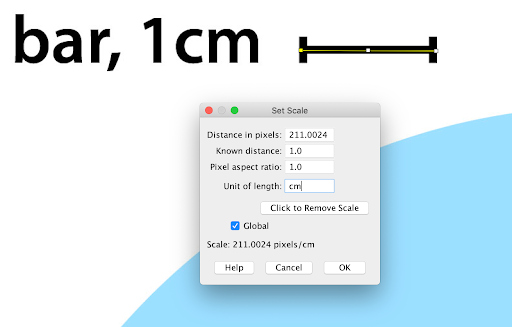
Next navigate back to the toolbar to Analyze → Set Scale. This feature will take the number of pixels that make up the line of the scale and equate this with a known distance. The known distance from the scale bar is 1cm and the distance in pixels should range between 200 and 220 pixels. Ensure the known distance is set to “1” and the unit of length is cm, or the unit that is listed in the scale bar. Tick the box marked “global” which will save this scale until the user updates it. Distances in pixels will vary slightly between individuals but should be within a range of +/- 10 pixels.
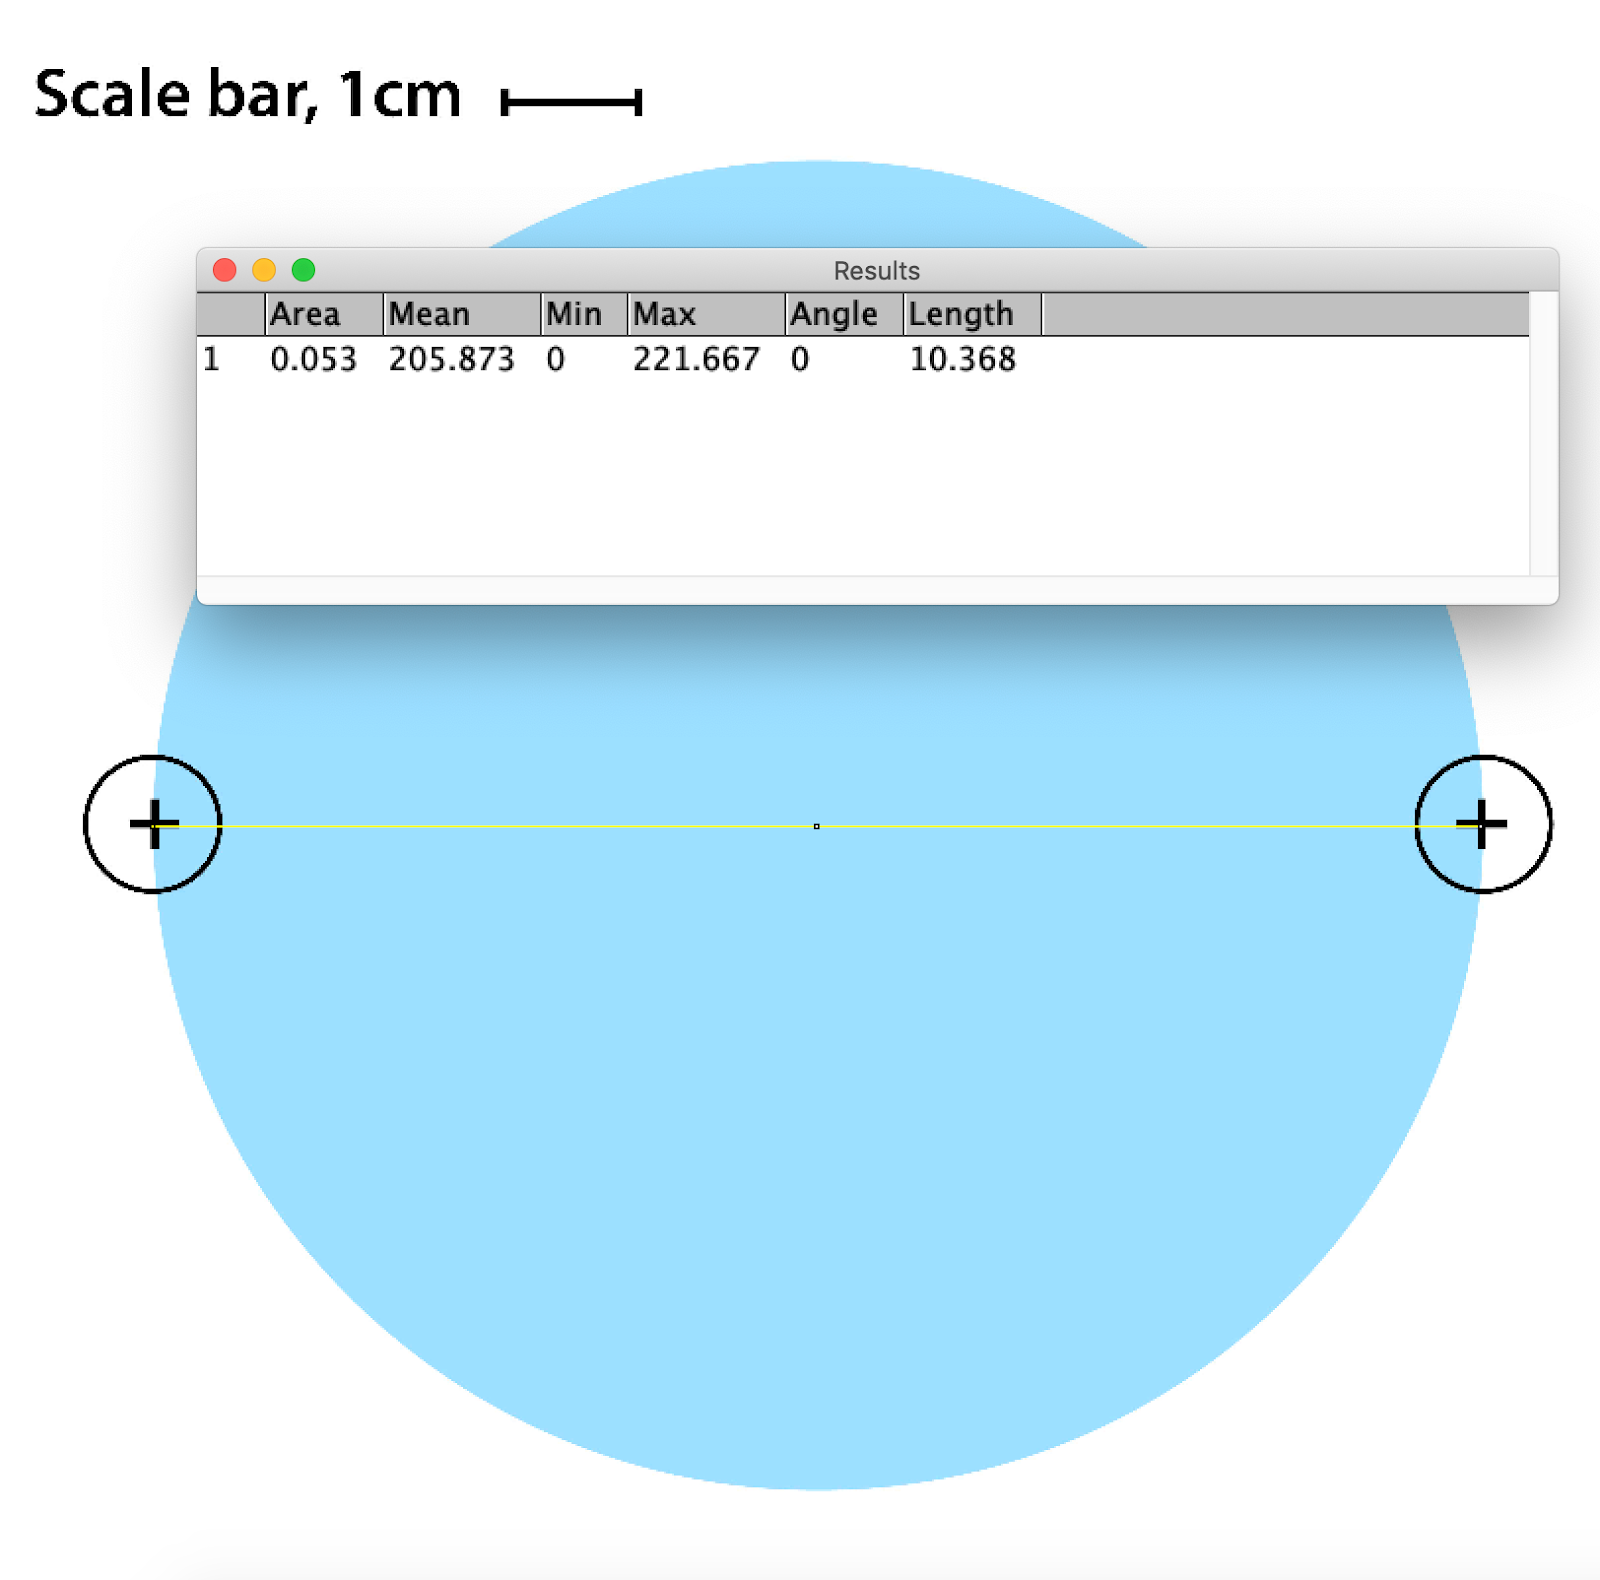
Once the scale has been set, practice measuring the diameter of the circle in the image.
The diameter of a circle is the straight line segment that passes through the center of the circle and connects two points on its boundary. It is the longest straight line that can be drawn.

Navigate back to the cal_practice_ image.jpg opened within ImageJ and using the straight line tool, draw a line across the diameter of the circle. Next, select Analyze→ Measure. A row of cells will print in the Results table with the final data column containing the length measurement. The length column will record the diameter of the circle in centimeters based on the scale bar measured in the original image.
Practice measuring the diameter several times, practice zooming into the image to garner a more accurate measurement. Keyboard shortcuts can be utilized for repeated measurements. The diameter of the circle should fall between 9.200 and 10.500 cm if the scale in Step 2 has been set correctly.
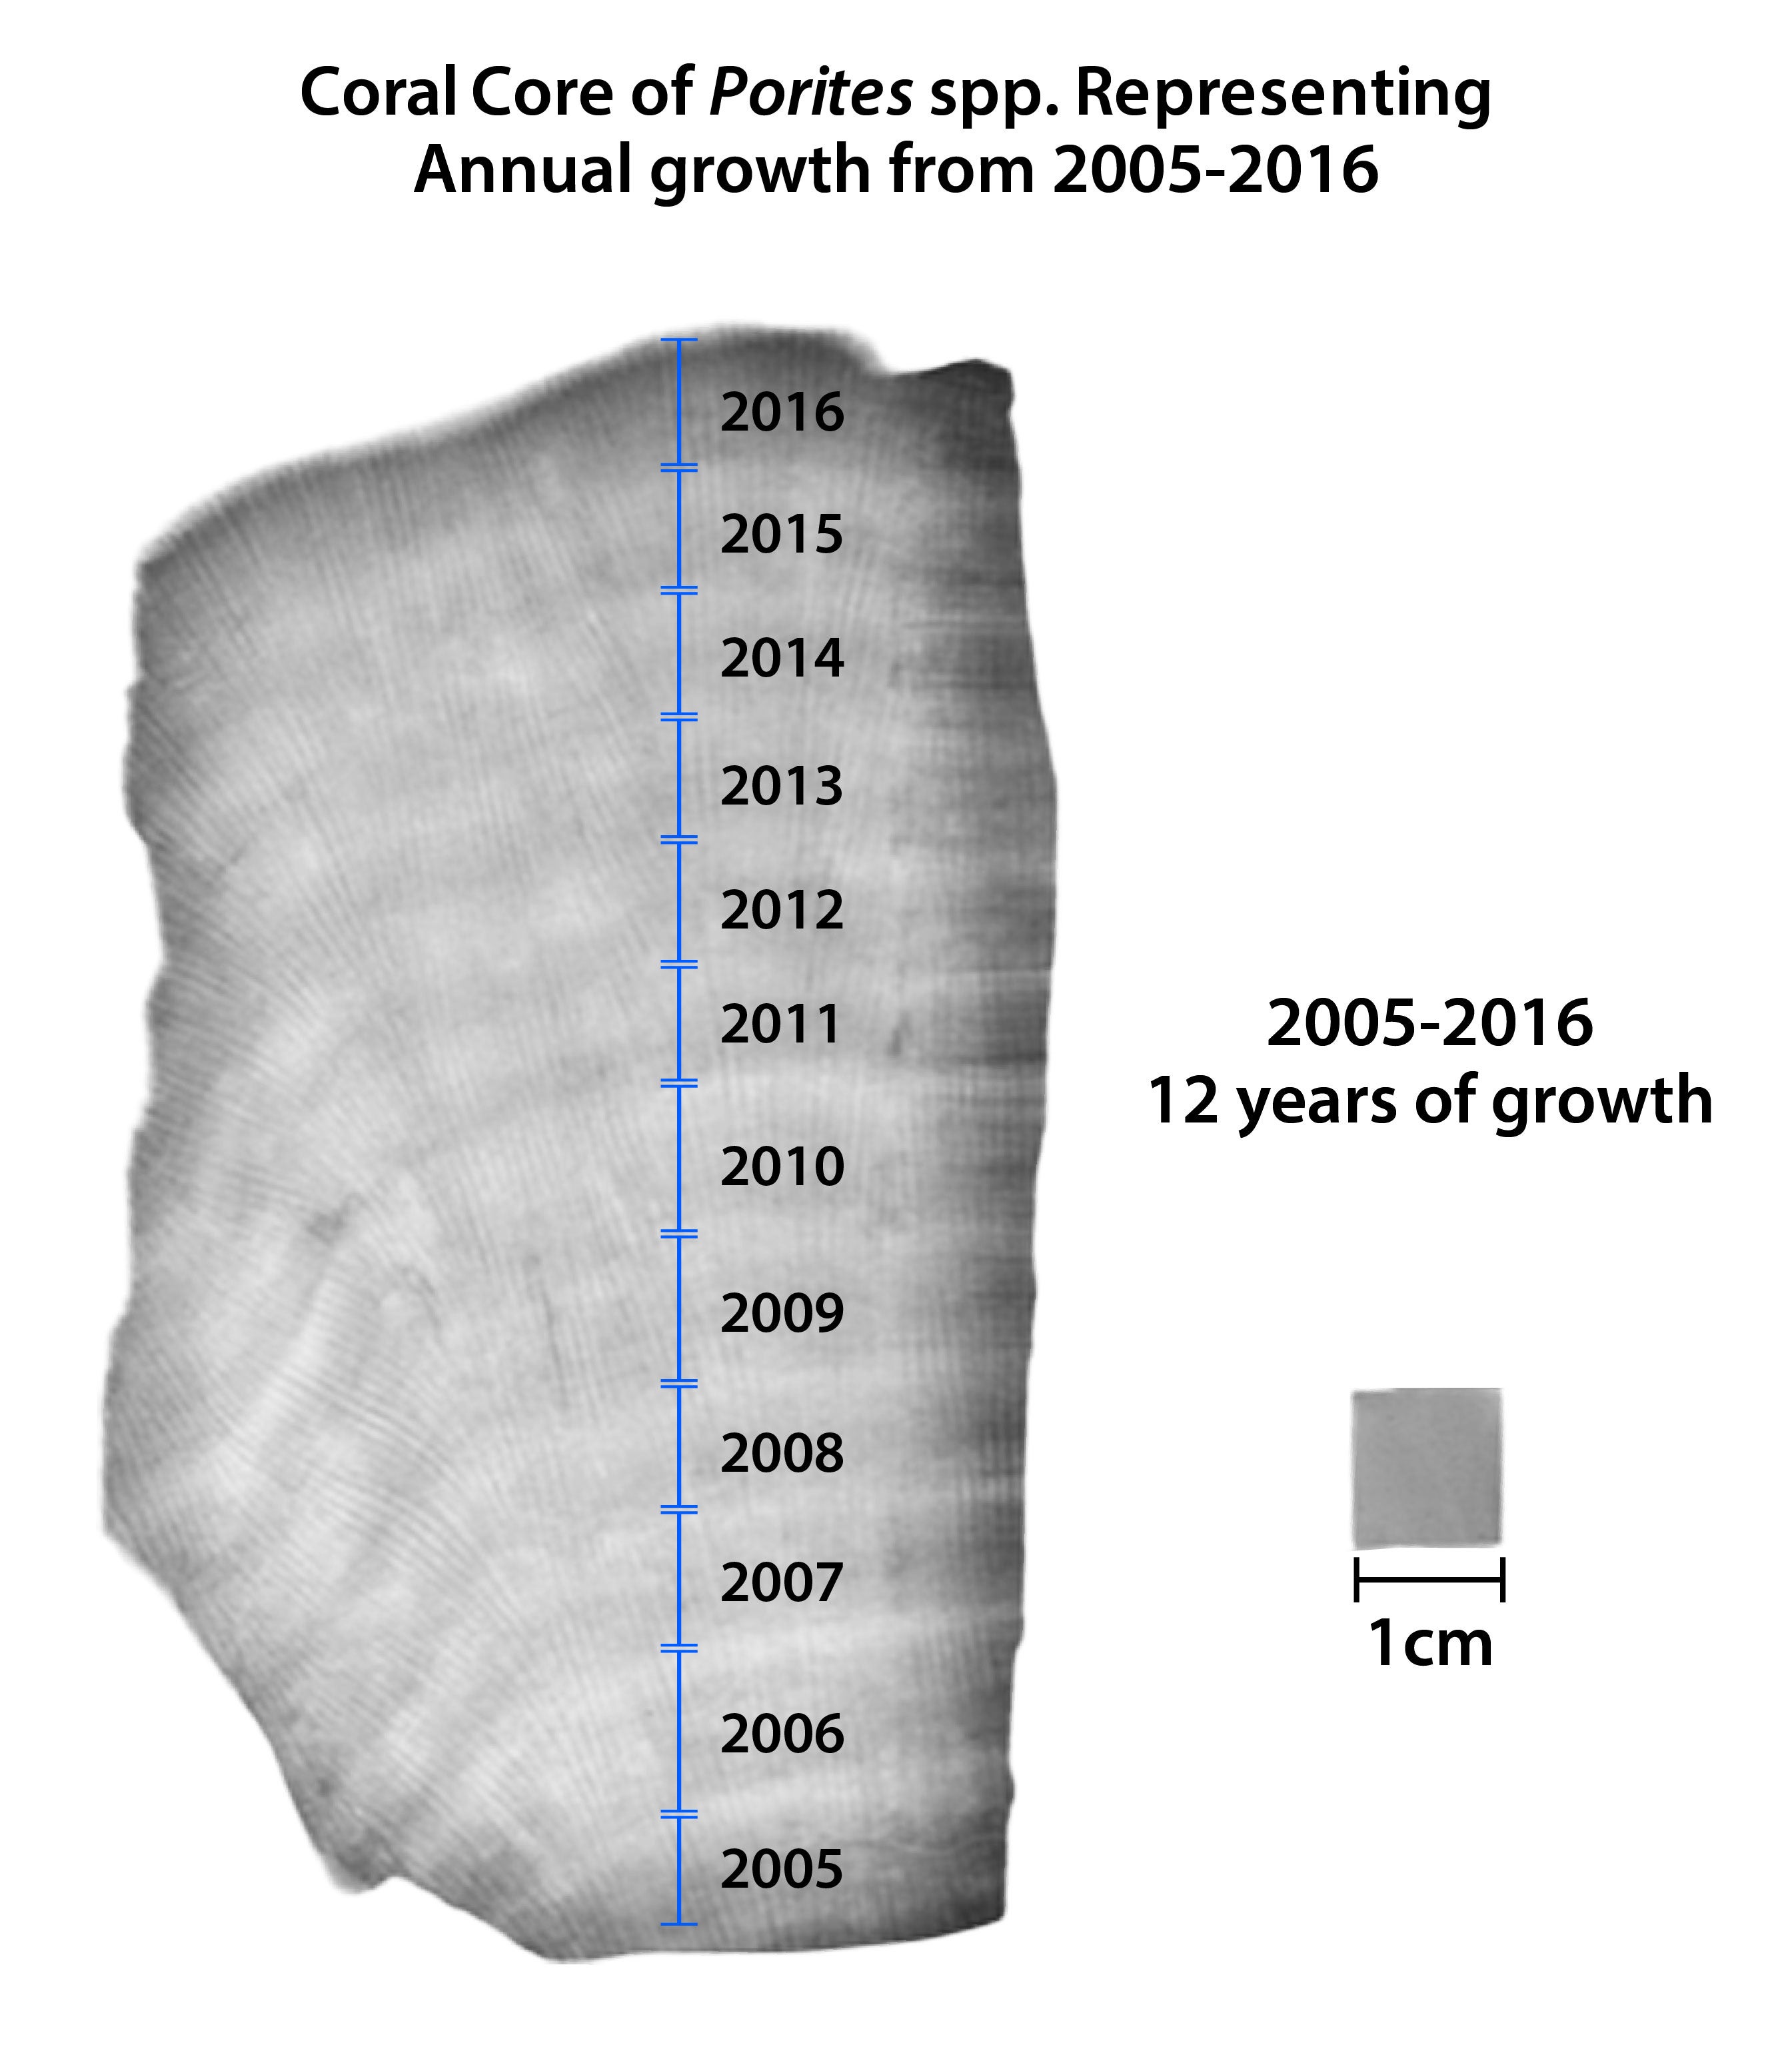
A coral growth band is a visible layer of calcified skeletal material deposited by corals over time, indicating periods of growth.
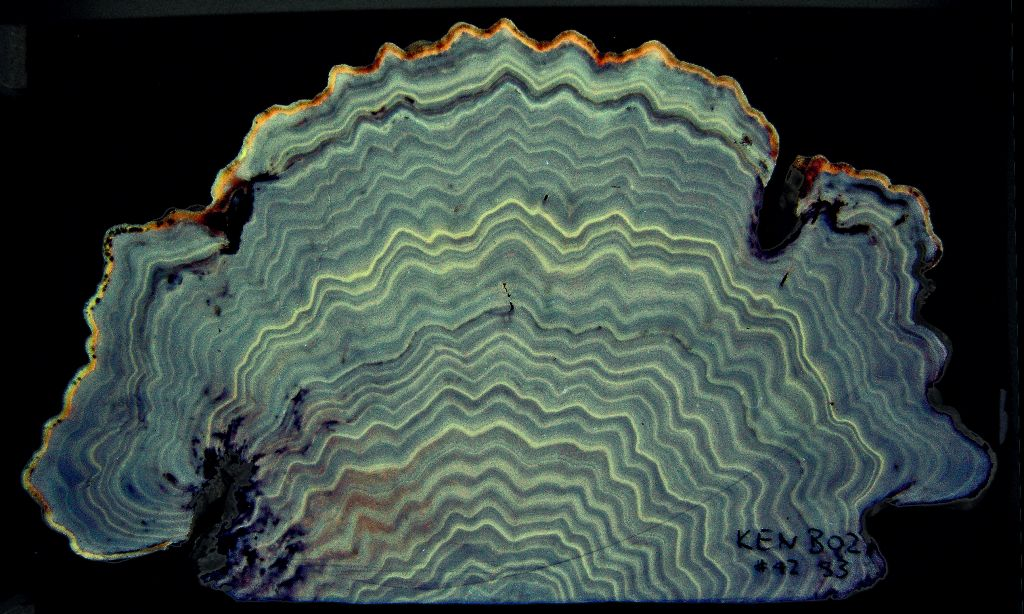
Image credit: https://climatehistory.com.au/palaeoclimate/coral-2/
Coral growth bands are similar to tree rings and show how much a coral has grown over a year. Coral skeletal growth extension can be influenced by many abiotic factors that can have seasonal variation. Coral growth bands can be used to understand the health of coral reefs and how they respond to seasonal changes in their environment.
To conduct an investigation into coral growth bands, download the coral core image to process growth band data and save to a known place. The file name to save is “coral_core_growth_band" Open the downloaded file in ImageJ.
Navigate to Analyze → Set Scale. This feature will take the number of pixels that make up the line of the scale and equate this with a known distance. The known distance from the scale bar is 1cm.
Ensure the known distance is set to “1” and the unit of length is cm, or the unit listed in the scale bar. Tick the box marked “global” and click “OK” which will save this scale until the user updates it. Distances in pixels will vary slightly between individuals but each band should be within the range of 0.7 and 1.3 cm.
If not in range, it may require a return to the beginning of Step 5.
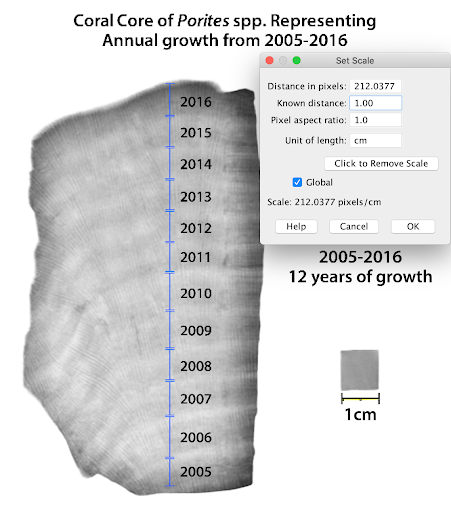
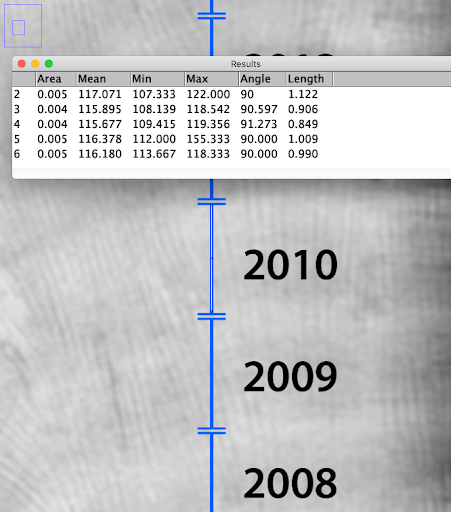
Once the scale is set each year can be measured separately by utilizing the Analyze → Measure function. Take twelve measurements, one for each year, starting with 2005.
 | The magnifying glass tool on the toolbar can be utilized for zooming into the coral growth band for the most accurate measurement. | |
 | The scrolling hand tool on the toolbar can be used to additionally move the image from year to year. | |
 | Ensure to switch back to the line tool to make the measurement. |
To transfer the data into Google Sheets or Microsoft Excel you will need to highlight the table or save it a .csv file and import it. Once the table is highlighted, navigate to top toolbar to Edit → Copy and then open a Google Sheet or .xls worksheet and select Edit → Paste
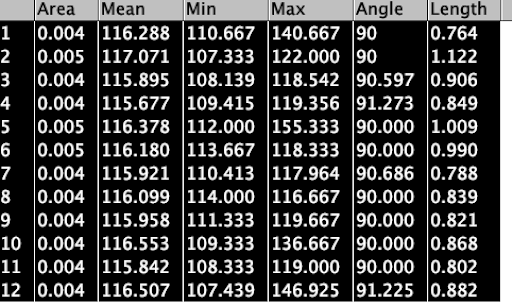
Once in the spreadsheet format select the length column, all other columns can be deleted by holding “Shift” and highlighting multiple columns and then right click “Delete” (Number, Area, Mean, Min, Max and Angle). Ensure each year is placed alongside the annual growth (cm) data and by the sequential years of 2005-2016. Label the column headers as Column A: Annual Length (cm) = Growth and Column B as Year. The spreadsheet should read like the example below.
The data sheet should now have Column A as Annual Length (cm)= Growth and Column B as the Year in Microsoft Excel or a Google Sheet. The next step will be running simple calculations with the data.
Each calculation made below will be within a cell (eg. A16). A cell is a small box, coded by letter and number where data is entered. In some cases a command can be used to query the data. Commands within the cell will begin with an “=” sign and the command will begin to appear in the Formulas Bar, indicated by fx. If a cell contains a formula, the Formula Bar will display the full formula, while the cell will show the result.
Add the below formulas to the spreadsheet in Column A to be calculated in Column B (B15-B19)
The AVERAGE function in Excel is used to calculate the mean of a set of numbers or values. It adds up all the numbers in a given range and then divides the sum by the total number of values in that range. The “=” sign indicates in Excel that a function is being utilized. The function AVERAGE is entered and next an open parenthesis is added “(“ . The user can then highlight all of Column A and then close the parentheses “)” and hit “Enter”.
![]()
=AVERAGE(A2:A13)
The MAX function is used to find the largest (maximum) value in a range of numbers. To search Column A for the largest value, or in this case, the maximum growth year, enter the following function in the fx. The “=” sign indicates in Excel that a function is being utilized. The function MAX is entered and next an open parenthesis is added “(“ . The user can then highlight all of Column A and then close the parentheses “)” and hit “Enter”.
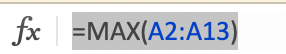
=MAX(A2:A13)
The MATCH function in Excel is used to determine where an item is located or its position within a specified range of numbers. To search Column A for the position of this number in a large dataset, you will enter the following function in the fx. The “=” sign indicates in Excel that a function is being utilized. The function MATCH is entered and next an open parenthesis is added “(“ . The user can then add the MAX value calculated in the previous step and then add a comma “,” and highlight all of Column A, add a second comma “,” and add “0” and then close the parentheses “)” and hit “Enter”.
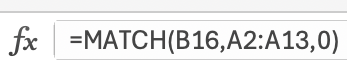
=MATCH(B16, A2:A13, 0)
This would indicate which row is where the maximum value is found in the dataset. This maximum value would be relatively easy to see in a small dataset like this. In much larger datasets it would allow the researcher to quickly locate the row of this value.
The INDEX function in Excel is used to return the value of a cell within a specified range based on a row and column number, retrieving data from a specific position. The “=” sign indicates in Excel that a function is being utilized. The function INDEX is entered and next an open parenthesis is added “(“ . The user can then highlight all of Column B, add a comma “,” and add “position calculated in previous step” and then close the parentheses “)” and hit “Enter”.
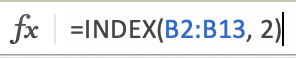
=INDEX(B2:B13, 2)
The above code uses (,2) which was the computer MATCH. Additionally, this formula could click directly on the cell that calculated the Match function (eg. B17) to derive the same year result.
Tip: Difference between the MATCH function and the INDEX function.
The MATCH function returns the relative position of an item (for example which row it is in) while the INDEX function returns the value of the item itself
Utilizing Match and Index is a useful tool for looking at large datasets.
Use MATCH to find the row number of 2 in the first column with the maximum value.
Use INDEX to retrieve the corresponding year from the second column.
Copy the below formula into Excel or Google Sheets. Please note that the MAX value calculated earlier in the exercise will be slightly different. In this example it was 1.122 cm. Once the formula is complete, hit Enter and the year with the most growth will appear.
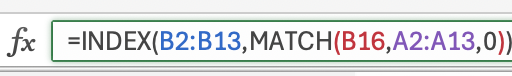
=INDEX(B2:B13,MATCH(B16,A2:A13,0))
These formulas can additionally be used to calculate the year with the least growth by beginning with the “MIN” function. Try calculating the MIN and INDEX and MATCH FUNCTION on your own.
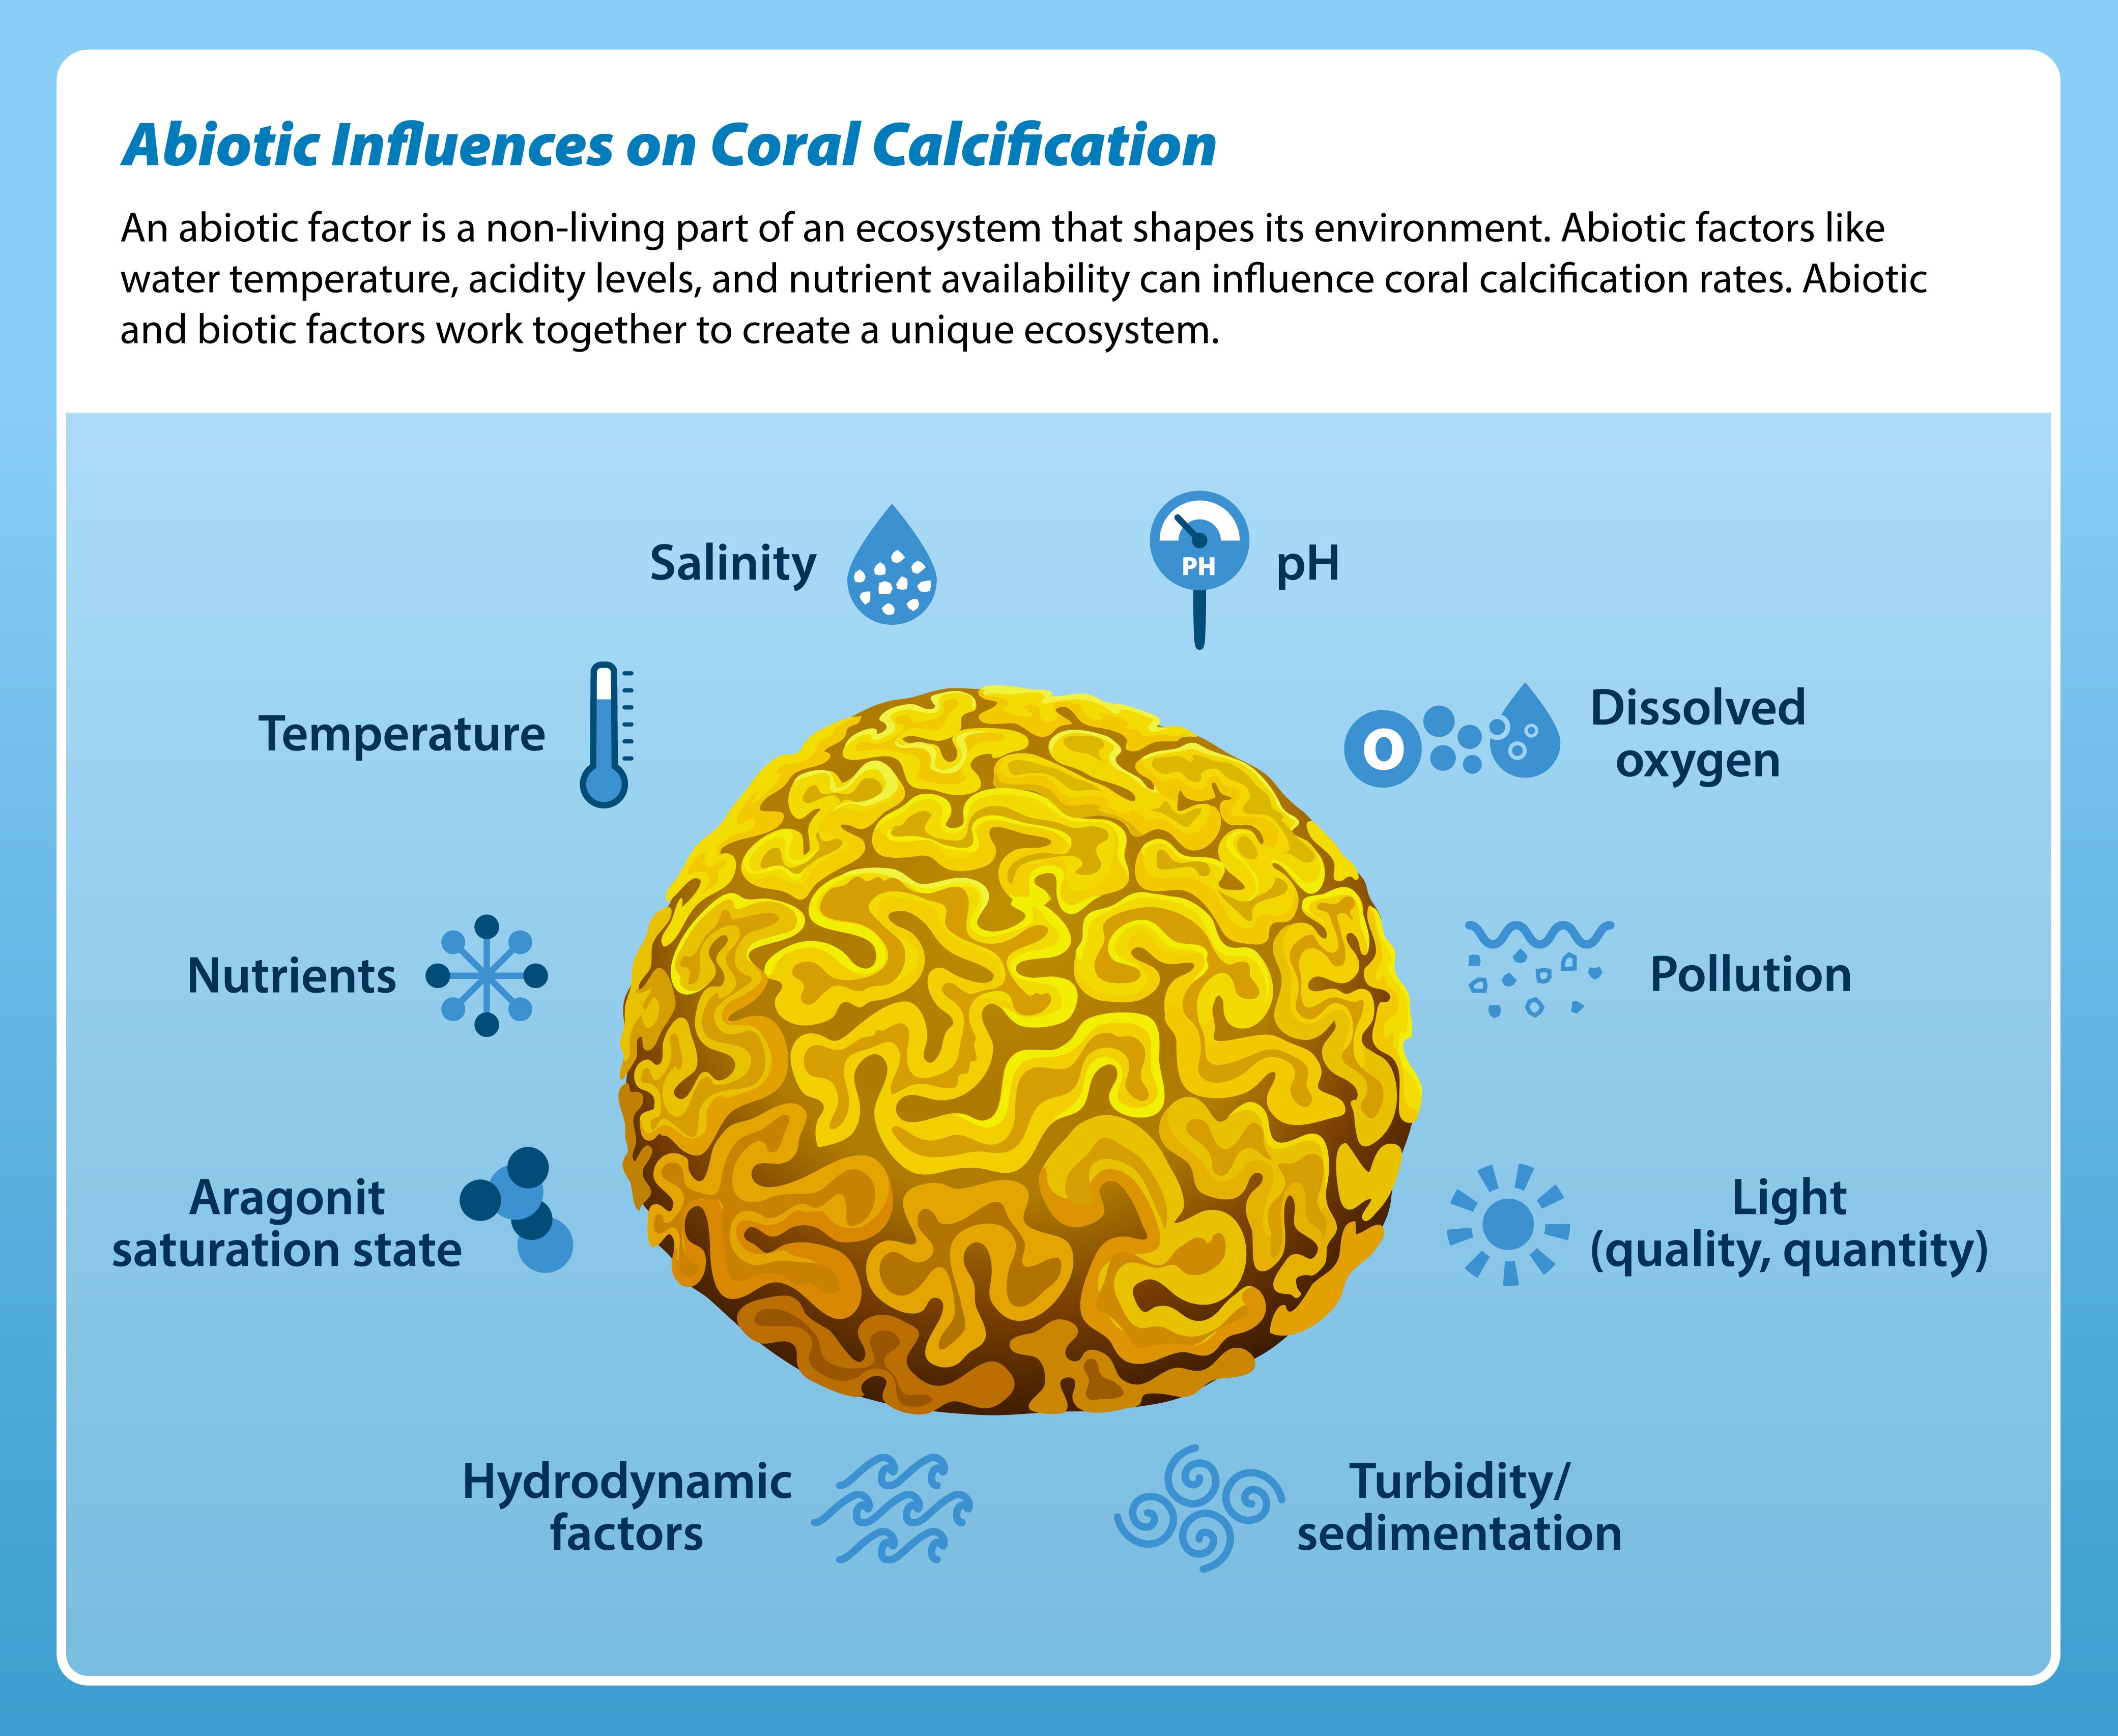
Coral core data is an invaluable tool for understanding how abiotic factors like sea surface temperature, salinity, nutrients, ocean acidity, and natural disturbances and patterns influence coral growth and health. By analyzing coral cores, scientists can reconstruct past environmental conditions, providing insights into how corals have responded to these conditions over time.
The coral core measured in this lesson was taken from Gili Selang, an island in Indonesia. What are some abiotic factors that could influence coral growth in this region?
https://www.whoi.edu/oceanus/feature/how-do-corals-build-their-skeletons/
https://www.ncei.noaa.gov/news/how-can-corals-teach-us-about-climate
https://agupubs.onlinelibrary.wiley.com/doi/full/10.1029/2018PA003387
https://www.sciencedirect.com/science/article/abs/pii/S0031018223001062